Sea Floor Mapping Upgrades

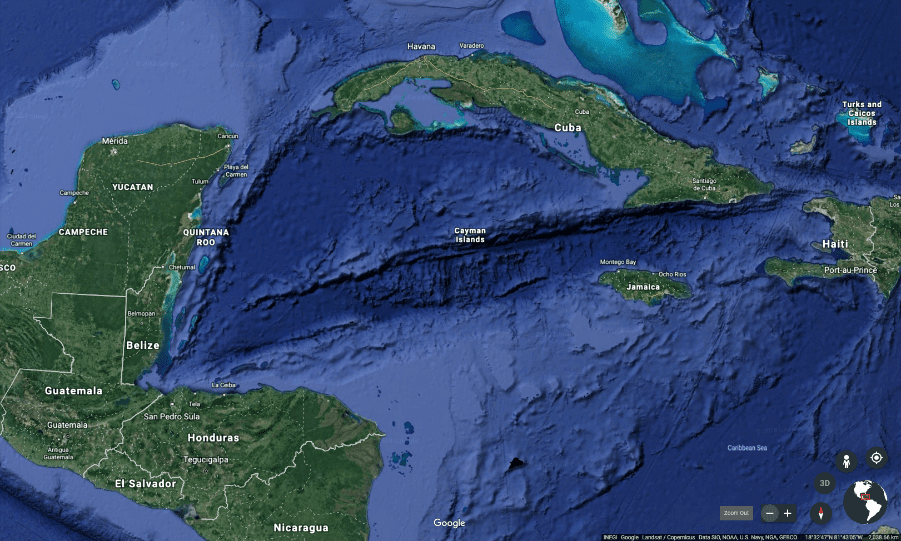
Sea floor mapping of the Caribbean

Advances in Sea Floor Mapping

Northern Gulf of Mexico deepwater bathymetry grid featuring salt tectonics, made from the oil industry’s 3-D seismic surveys.

Extract from the BOEM Article Showing the Location of New Under-sea Mapping
Northern Gulf of Mexico deepwater bathymetry grid.  We create this from 3-D seismic surveys. The grid defines water depth with 1.4 billion 12 × 12 meter cells. BOEM grid coverage is limited to the area defined by rainbow colors.

This article shows the use of high resolution of sea floor mapping. In fact the sea floor mapping in view in this article covers the Gulf of Mexico. So, by using high-res in this case, one provides better resolution and interpretation of sea-floor features. Indeed, this may well include methane hydrate resource patterns and history.

The U.S. Department of the Interior’s Bureau of Ocean Energy Management (BOEM) has now created and released a new regional seafloor data set. It reveals that dynamic environment with stunning new clarity. The data include detailed seismic surveys originally shot by 15 different companies involved in the oil and gas industry. In addition, BOEM gained permission to release the relevant proprietary data publicly in a freely downloadable aggregate map of the seafloor. The detailed report is referenced below.

A number of examples show the improved interpretation potential of the maps available with the higher resolution. The location of methane hydrates becomes distinctly more possible to determine.

See https://eos.org/project-updates/a-1-4-billion-pixel-map-of-the-gulf-of-mexico-seafloor
Skip to content